〔Visiting Professor Report〕Prof. Dieter Bilitza (George Mason University and NASA/GSFC/SPDF)
Updated: 2023/02/02
An Evaluation and Assessment of Empirical Plasmasphere Models with the Goal of Extending the International Reference Ionosphere (IRI) to Plasmaspheric Altitudes
Prof. Dieter Bilitza (George Mason University and NASA/GSFC/SPDF)

With more and more of our daily life depending so much on space technology it is critically important to have an accurate and reliable representation of the Earth’s geo-space environment. The ionosphere and plasmasphere are a particularly important part of geospace, because any technique that uses a probing signal travelling through these regions needs to account for the retarding and refractive effect that these regions impose on the signal. The International Reference Ionosphere (IRI) is the internationally accepted standard for the representation of ionospheric parameters and officially certified as such by the International Standardization Organization (ISO). As requested by the sponsoring organizations, Committee on Space Research (COSPAR) and International Union of Radio Science (URSI), IRI is an empirical, data-based models so that it would not depend on the evolving theoretical understanding of the processes that shape this particular region of space. As one of the principal authors of the IRI model, the primary goal of my research visit at RISH was to extend the altitudinal range of this ionospheric standard to plasmaspheric heights. Several empirical plasmaspheric models have been developed based on different data sources and different theoretical assumptions. A modular approach is common to most models combining sub-models for the different distinct plasmasphere regions: from the “saturated” plasmasphere to the steep gradient at the plasmapause, and the much lower densities in the trough region. An assessment and evaluation of these models with a set of reliable data sources is the first step towards implementation of one of these into IRI. The parameter of most interest for model applications is the plasmaspheric electron density and therefore, it is the focus of my study. Three models have a particularly high citation record indicating their wide usage: (1) The Carpenter and Anderson (1992) model is a classic and served as baseline for many of the later models. It is based on ISEE 1 sweep frequency receiver data and ground-based Whistler measurements. (2) Gallagher et al. (2000) developed their Global Core Plasma Model (GCPM) relying predominantly on data from the Retarding Ion Mass Spectometer (RIMS) and Plasma Wave Instrument (PWI) instruments on the Dynamics Explorer 1 (DE-1) satellite. (3) The model of Ozhogin et al. (2012) is based on density data derived from active sounding along magnetic field lines by the Radio Plasma Imager (RPI) on the Imager of Magnetopause-to-Aurora Global Exploration (IMAGE) satellite and does not assume diffusive equilibrium like the other two models, so it depends not only on the L-shell but also on the magnetic latitude along the field-line. Data acquire with three different techniques during three different satellite missions with good coverage of the plasmasphere region were used for the model assessment: DE-1/RIMS (1981-1984), IMAGE/RPI (2001-2005) and CRRES/PWR (Combined Release and Radiation Effects Satellite / Plasma Wave Receiver) (1990-1991). Figures 1,2,3 show the percentage error distribution between data and models for the three data sets. The x-axis is divided into 10% bins and the y-axis shows how many data-model errors were sampled for each bin. For example, if we look at the 0-10% error bin in Figure 3, the Carpenter-1992 model is representing about 40,000 data points with this percentage accuracy, the Ozhogin-2012 for about 38,000 data points, and the Gallagher-2002 only for about 22,000 data points. Also listed are the medians and standard deviations and the percentage bins where each distributions peak. All three distributions are skewed towards negative values indicating a general overestimation of the data by the models which is also documented in the median values. Overall the Ozhogin-2012 model shows the best results with the Carpenter-1992 model a close second. In a first attempt both models were included in IRI with the Ozhogin-2012 the recommended default and the Carpenter-1992 as an alternate option. They were connected to the standard IRI model using Epstein transition functions in similar fashion as is done for the plasma temperatures and ion composition in IRI. A description of the connection process and an in-depth description of the IRI model are included in a recent review paper (Bilitza et al., Reviews of Geophysics, 60, e2022RG000792, 2022, https://doi.org/10.1029/2022RG000792 ).
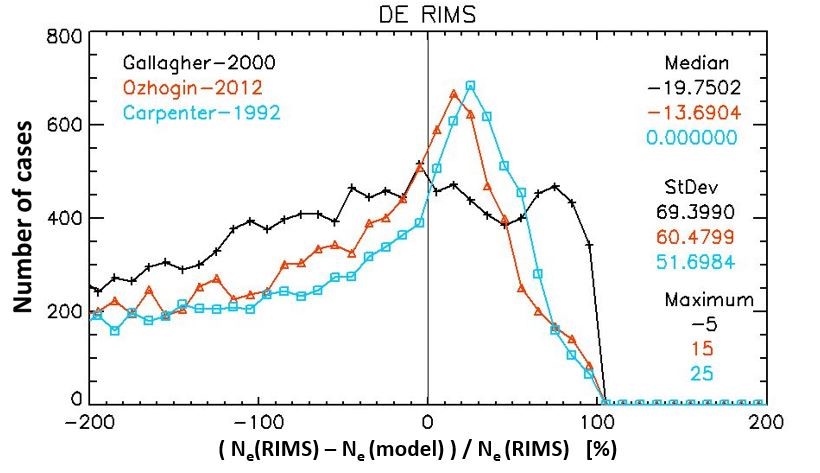
Fig. 1. Percentage error distribution between the DE-1/RIMS data and the three models: Gallagher et al. (2000), Ozhogin et al. (2012) and Carpenter & Anderson (1992). A point (x,y) on the curves indicates the number of cases (y) with a percentage error of x ± 5%. Also listed are the medians, standard deviations and peak percentages for all three models.
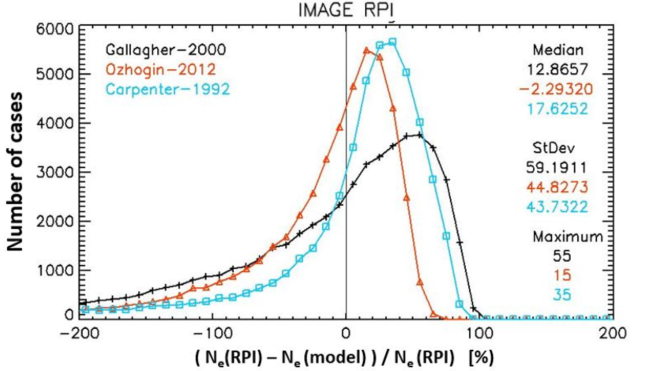
Fig. 2. Same as Figure 1 for the IMAGE/RPI data
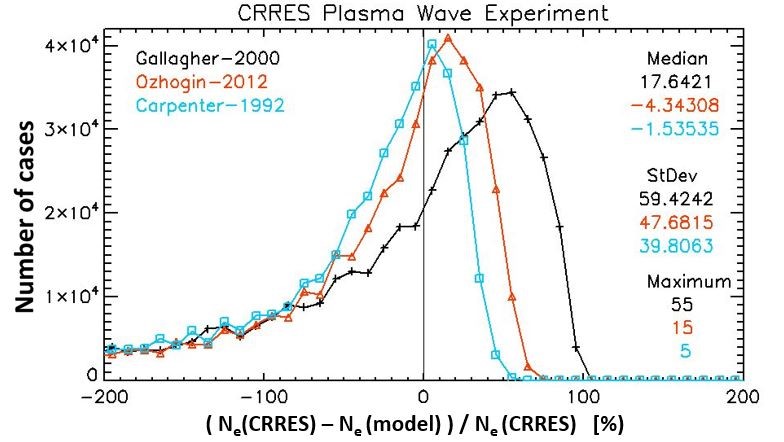
Fig. 3. Same as Figure 1 for the CRRES/PWR data