282nd Regular Open Seminar
Simulation study of electron zebra stripes in the Earth’s inner magnetosphere
| 開催日時 | 2022-06-22 12:30–13:20 |
|---|
Presenter: Megha Mahendra Pandya (Mission Research Fellow, RISH, Kyoto University)
Title: Simulation study of electron zebra stripes in the Earth’s inner magnetosphere
Place: Online
Associated Mission: Mission 3 (Sustainable Space Environments for Humankind)
If you would like to participate, please e-mail me your name, affiliation and e-mail address by 10 am on the day.
(Open Seminar Office: openseminar@rish.kyoto-u.ac.jp)
Abstract
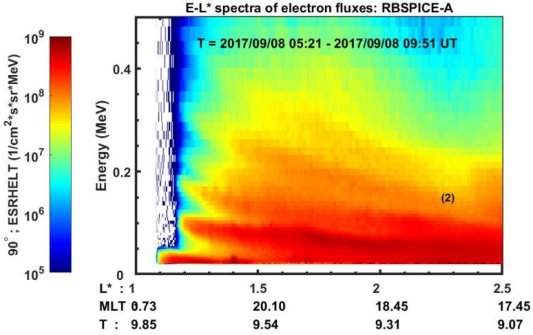
The “zebra stripes” are the characteristic feature of electron fluxes recorded in the inner magnetospheres of Earth and other planets like Saturn. It is important to study such features as it delineates the magnetospheric processes and helps understand the space environment around Earth and exoplanets. They appear like banded structures of the electron fluxes, having energies 20–500 keV in the distance (L-value) and energy plots as shown in Figure 1. They are usually observed in the inner belt and the slot region (L<3) of the Earth’s magnetosphere. We studied the characteristic features of the minima and maxima in electron zebra stripes observed during one of the outbound passages of Van Allen Probes-A on September 8, 2017. To understand the cause of formation of electron zebra stripes we performed an advection simulation to understand spatial-temporal evolution of energetic electrons trapped in the inner magnetosphere. We used the electric field obtained by a global MHD simulation. Back-tracing the trajectory of the electrons gives the information about the initial location of the electron forming the minima and maxima in the electron zebra stripes. The properties like, duration of initial inward transport, MLT range, averaged radial speed and averaged azimuthal electric field of the initial inward transport of electrons giving rise to the maxima and minima at different energies are computed. In this talk, an explanation for the formation of maxima and minima in the electron zebra stripes will be provided.
 Figure 1. The electron zebra stripes of the energetic electron fluxes on the energy versus L-value spectrogram. They were recorded by RBSPICE-A on board the Van Allen Probe A on 08 September 2017.
PDF file (607 911 bytes) | Top
9 June, 2022
